2021-02-01
16:42:17
8001

应用监控
应用监控
当一个SpringBoot项目运行时,开发者可以对SpringBoot项目进行实时监控 ,获取项目运行情况,在项目出错时能够实现自动报警等。
Spring boot Actuator 提供了一系列的端点来监控和度量应用,包括应用上下文全部Bean信息,自动化配置报告(显示自动配置条件是否通过)。
- 包括健康状况、应用信息、内存使用情况等。
- 可以通过http, JMX, SSH协议来进行操作
案例代码(基于http):https://github.com/xiongsihao/springBoot_demo
一. 监控和管理端点
端点列表:
| 端点名 | 描述 |
|---|---|
| actuator | 所有EndPoint的列表,需加入spring HATEOAS |
| autoconfig | 当前应用的所有自动配置 |
| beans | 当前应用的所有Bean信息 |
| configprops | 当前应用的所有配置属性,即@ConfigurationProperties的列表 |
| dump | 显示当前应用线程状态信息 |
| env | 显示当前应用当前环境信息 |
| health | 显示当前应用健康状况 |
| info | 显示当前应用信息 |
| metrics | 显示当前应用的各项指标信息 |
| mappings | 显示所有的@RequestMapping映射的路径 |
| shutdown | 远程关闭应用接口,不支持GET,支持POST(需手动开启) |
| trace | 显示追踪信息 |
| auditevents | 展示当前应用程序的事件信息 |
| conditions | 展示一个自动配置类的使用报告,该报告展示所有自动配置类及它们被使用或未被使用的原因 |
| httptrace | 展示 trace 信息(默认为最新的100条HTTP请求) |
| loggers | 展示并修改应用的日志配置 |
| scheduledtasks | 展示应用的所有定时任务 |
| sess | 展示并操作 SpringSession会话 |
| threaddump | 展示线程活动的快照 |
如果是Web应用,除上面的端点外还会有以下列表的端点:
| 端点名 | 描述 |
|---|---|
| heapdump | 返回 GZip 压缩的 hprof 堆转储文件 |
| jolokia | 展示通 http暴露的JMX beans |
| logfile | 返回日志文件内容 |
| prometheus | 展示一个可以被prometheus服务器抓取的metrics数据;可用于信息采集,监控信息可视化。 |
1.1 开启端点
可以通过http实现对应用的监控和管理,只需要在pom.xml中增加以下依赖即可:
<dependency>
        <groupId>org.springframework.boot</groupId>
        <artifactId>spring-boot-starter-actuator</artifactId>
</dependency>

<dependency>
    <groupId>org.springframework.boot</groupId>
    <artifactId>spring-boot-starter-web</artifactId>
</dependency>
引入依赖后,以上表格里列举的端点大部分都是默认开启的, 只有 shutdown 端点默认未开启, 如果需要使用需手动开启,可以在application.properties配置文件内加入以下配置开启:
management.endpoint.shutdown.enabled= true
如果不想暴露这么多端点,可以关闭默认配置,然后手动指定需要开启哪些端
点,如下配置表示关闭所有端点,只开启 info端点
management.endpoints.enabled-by-default=false
management.endpoint.info.enabled=true
1.2 暴露端点
由于有的端点包含项目的敏感信息,因此端点启用和暴露是不同的概念;
- 开启端点:功能被启用
- 暴露端点:公开端点,即可被直接访问
在web应用中,默认只有 health和info两个端点暴露,即当引入actuator依赖并启动springBoot项目后,默认只有这两个url可以访问;
想要重新设置暴露哪些端点,可以使用include和exclude属性
| Property | Default |
|---|---|
management.endpoints.jmx.exposure.exclude | |
management.endpoints.jmx.exposure.include | * |
management.endpoints.web.exposure.exclude | |
management.endpoints.web.exposure.include | info, health |
include属性列出了暴露的端点列表,exclude属性列出的是不被暴露的端点的列表。exclude属性优先于include属性。*表示所有的端点
例如通过HTTP暴露所有端点除了env和beans端点,可以如下配置:
management.endpoints.web.exposure.include=*
management.endpoints.web.exposure.exclude=env,beans
由于*在 YAML 格式的配置文件中有特殊的含义,因此如果在 YAML 中配置暴露所有端点,可使用 “*” 配置:
management:
 endpoints:
  web:
   exposure:
    include :"*"
注:部分特殊端点需要配合其它依赖使用,比如sessions端点需要spring-session 依赖
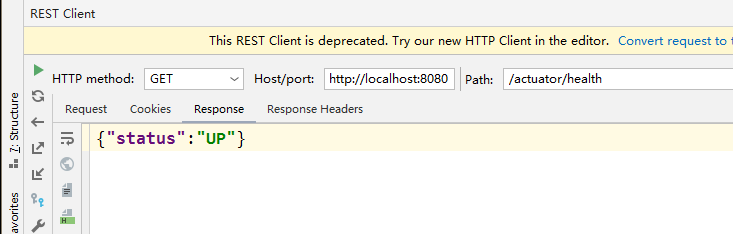
运行项目后即可直接访问端点url, 需添加前缀/actuator:
检测项目健康状态:
访问:http://localhost:8080/actuator/health
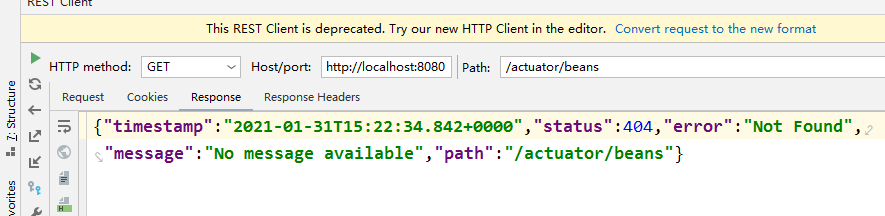
访问未暴露的端点:
如果想要服务与监控服务分开端口管理,可使用以下配置指定不同的端口
#服务运行端口
server:
  port: 8080

management:
  server:
    # 设置actuator监控服务端口
    port: 8081
1.3 端点保护
当必须暴露某些端点且不希望被非法调用时,可以做好对应的保护措施,配置HTTP端点的安全策略。
如果依赖存在Spring Security,则默认使用Spring Security的内容协商策略保护端点。
<dependency>
    <groupId>org.springframework.boot</groupId>
    <artifactId>spring-boot-starter-security</artifactId>
</dependency>
并加入以下配置:
@Configuration
public class ActuatorSecurity extends WebSecurityConfigurerAdapter {

	@Override
	protected void configure(HttpSecurity http) throws Exception {
		http.requestMatcher(EndpointRequest.toAnyEndpoint()).authorizeRequests()
				.anyRequest().hasRole("ENDPOINT_ADMIN")
				.and()
			.httpBasic();
	}

}
上面的配置类中EndpointRequest.toAnyEndpoint()就表示对任何端点的请求都必须确保该用户拥有ENDPOINT_ADMIN角色才可以访问。
在配置文件内添加一个角色用于测试端点保护:
spring:
  security:
    user:
      name: admin
      password: 111111
      roles: ENDPOINT_ADMIN
重新运行项目后访问http://localhost:8081/actuator/health,此时弹出窗口提示需要输入账号与密码才可以访问
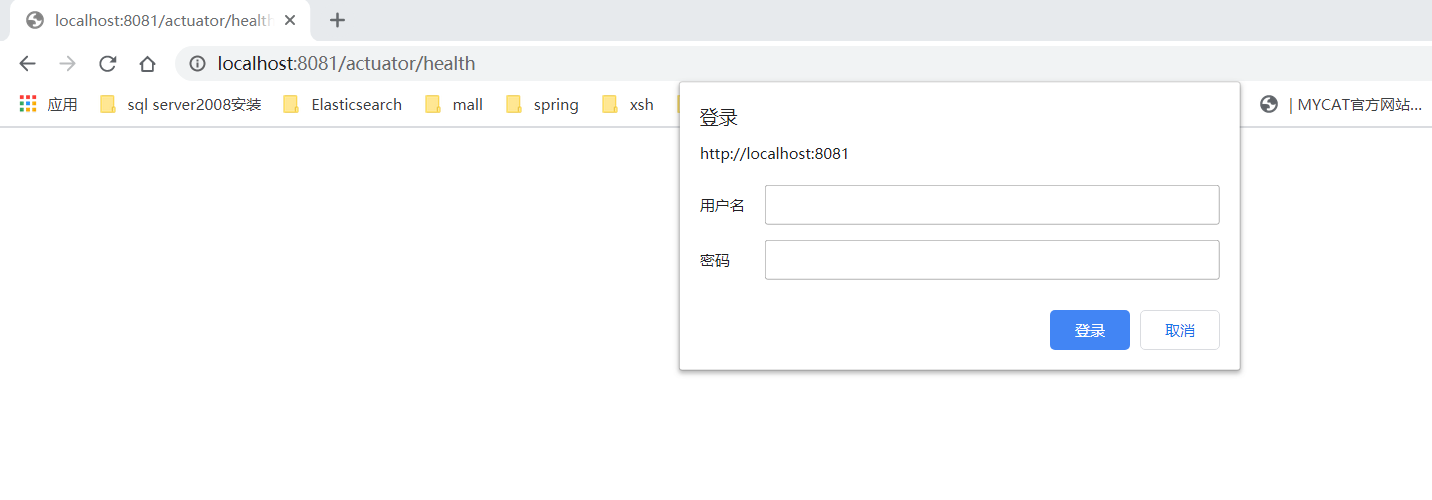
输入配置文件内定义的账号即可正常访问。
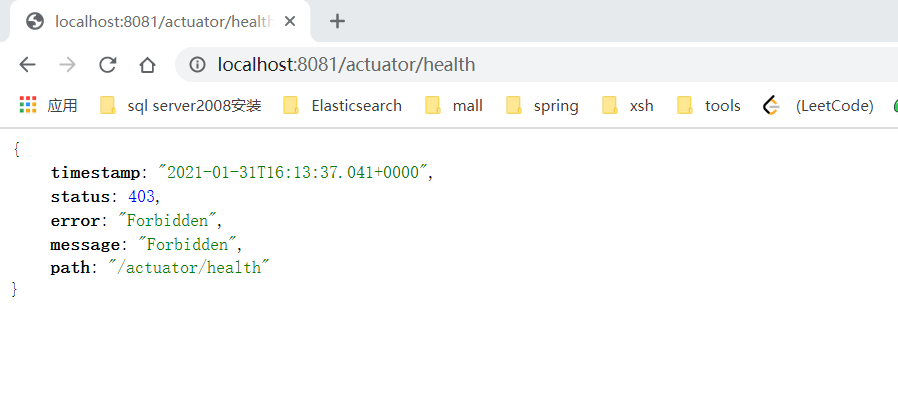
当账号和密码都正确,但是没有访问端点的权限时,提示:
1.4 端点响应缓存与路径映射
对于一些不带参数的端点请求会自动进行缓存 ,可以使用以下配置设置缓存的时间长短:
management.endpoint.beans.cache.time-to-live=10s
默认情况下,所有端点都暴露在“/actuator“路径下,例如health端点的访问路 径是 /actuator/health ,如果需要对端点路径进行定制 ,可通过如下配置进行
management.endpoints.web.base-path=/
management.endpoints.web.path-mapping.health=healthcheck
此时直接访问/healthcheck即可。
1.5 端点跨域
当端点需要被其它服务调用时,需要开启跨域访问;
management.endpoints.web.cors.allowed-origins=http://localhost:8083
management.endpoints.web.cors.allowed-methods=GET,POST
这个配置表示允许端点处理来自http://localhost:8083地址的请求,允许的请求方法为 GET,POST;非8083的请求将跨域无法调用端点
1.6 健康信息
开发者可以通过查看健康信息来获取应用的运行数据,进而提早发现应用问题,提早解决, 避免造成损失。默认情况下只能获取 status 信息,这是因为 detail 信息默认不显示,开发者可以通过 management.endpoint.health.show-details 属性来配置detail信息的显示策略,该属性的取值一共有三种:
- never:即不显示details 信息(默认选项)
- when-authorized : details 信息只展示给认证用户,即登录后才可以查看details信息,未登录不能查看,另外可以通过management.endpoint.health.roles 属性配置指定权限的角色才可以查看details信息;如果不配置那通过认证的用户都可以查看details信息无需鉴权
- always:将details信息展示给所有用户,无需登录也可查看。
在 pom.xml文件中引入Spring-Security 后,配置文件中增加如下配置:
management:
    health:
      show-details: when_authorized
      roles: ENDPOINT_ADMIN
spring:
  security:
    user:
      name: admin
      password: 111111
      roles: ENDPOINT_ADMIN
即拥有ENDPOINT_ADMIN权限的用户登录才可以查看details信息。
1.7 健康指示器
SpringBoot会根据classpath中依赖的情况来自动配置 Healthlndicators 。
| 名称 | 描述 |
|---|---|
| CassandraHealthIndicator | 检查Cassandra数据库是否已启动。 |
| CouchbaseHealthIndicator | 检查Couchbase群集是否启动。 |
| DiskSpaceHealthIndicator | 检查磁盘空间是否不足。 |
| DataSourceHealthIndicator | 检查是否可以获取到DataSource的连接。 |
| ElasticsearchHealthIndicator | 检查Elasticsearch群集是否启动。 |
| InfluxDbHealthIndicator | 检查InfluxDB服务器是否启动。 |
| JmsHealthIndicator | 检查JMS代理是否启动。 |
| MailHealthIndicator | 检查邮件服务器是否启动。 |
| MongoHealthIndicator | 检查Mongo数据库是否已启动。 |
| Neo4jHealthIndicator | 检查Neo4j服务器是否启动。 |
| RabbitHealthIndicator | 检查Rabbit服务器是否启动。 |
| RedisHealthIndicator | 检查Redis服务器是否启动。 |
| SolrHealthIndicator | 检查Solr服务器是否启动。 |
导入以下依赖用于测试健康指示器:
<dependency>
    <groupId>mysql</groupId>
    <artifactId>mysql-connector-java</artifactId>
    <scope>runtime</scope>
</dependency>
<dependency>
    <groupId>org.springframework.boot</groupId>
    <artifactId>spring-boot-starter-jdbc</artifactId>
</dependency>
<dependency>
    <groupId>org.springframework.boot</groupId>
    <artifactId>spring-boot-starter-data-redis</artifactId>
</dependency>
然后在application.yml中新增数据库配置:
spring:
  datasource:
    driver-class-name: com.mysql.cj.jdbc.Driver
    url: jdbc:mysql://127.0.0.1:3306/test?serverTimezone=Asia/Shanghai
    username: root
    password: 111111
  redis:
    host: 127.0.0.1
    port: 6379
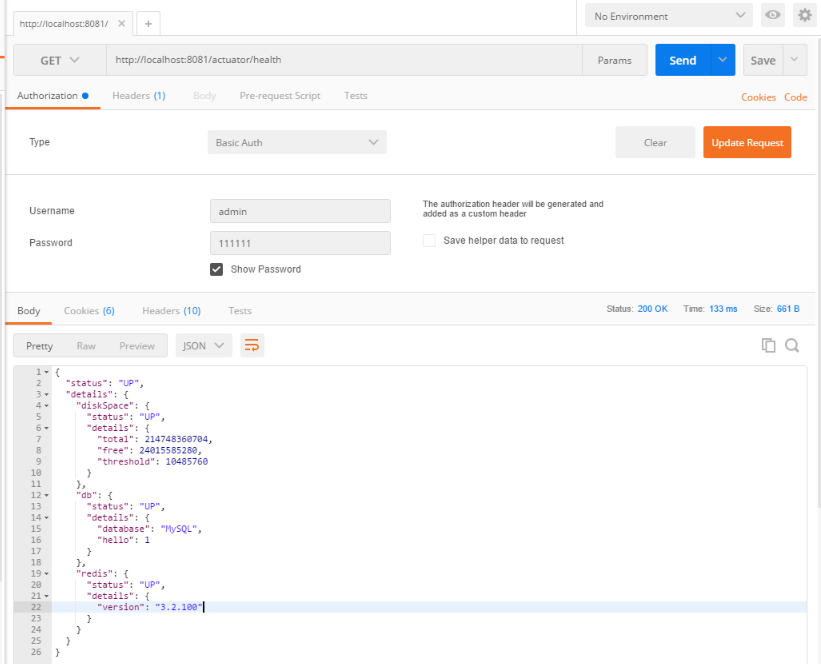
重启服务再次访问http://localhost:8081/actuator/health
可以浏览器输入密码访问,也可以使用postman访问;此时已显示了details信息且里面有已经引入的mysql和redis依赖的健康状态;
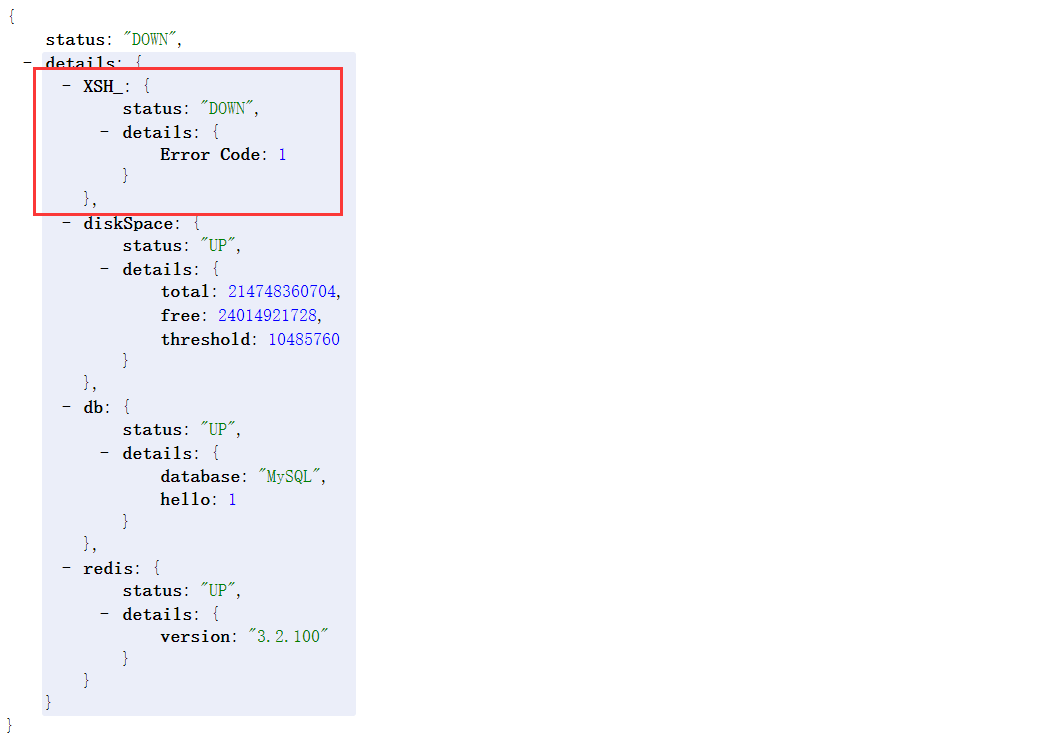
将redis服务关闭并将配置文件内的mysql密码故意改错,制造错误;重启服务再次访问,此时错误信息显示在details内,状态为down:

1.8 自定义HealthInfo
除了SpringBoot自动收集的HealthInfo之外,也可以自定义HealthInfo用来监控其它服务的运行状态,只需实现HealthIndicator 接口
@Component
public class XSH_HealthIndicator implements HealthIndicator {

    @Override
    public Health health() {
        /*这个errorCode可以是一些业务逻辑的执行情况的返回值或者某些服务的运行状态的返回值*/
        int errorCode = 0;
        //int errorCode = 1;
        if (errorCode != 0) {
            return Health.down().withDetail("Error Code", errorCode).build();
        }
        return Health.up().build();
    }

}
重启服务访问http://localhost:8081/actuator/health
此时自定义的健康状态信息已显示在details内,名字即为实现HealthIndicator接口的方法名。
默认的响应状态一共有4种,定义在 OrderedHealthAggregator类中,分别是 DOWN,OUT_OF_SERVICE,UP,UNKNOWN;如果想增加响应状态,可以自定义类继承自HealthAggregator,或者在 application .properties 中通过 management.health.status.order 属性进行配置。
例如增加一个新的相应状态:ERROR
management.health.status.order=ERROR,DOWN,OUT_OF_SERVICE,UP,UNKNOWN
创建一个类测试ERROR状态码:
@Component
public class errorClass implements HealthIndicator {

    @Override
    public Health health() {
        return Health.status("ERROR").withDetail("message","运行服务出现一个未知的错误").build();
    }
}
重启服务访问健康检测链接:
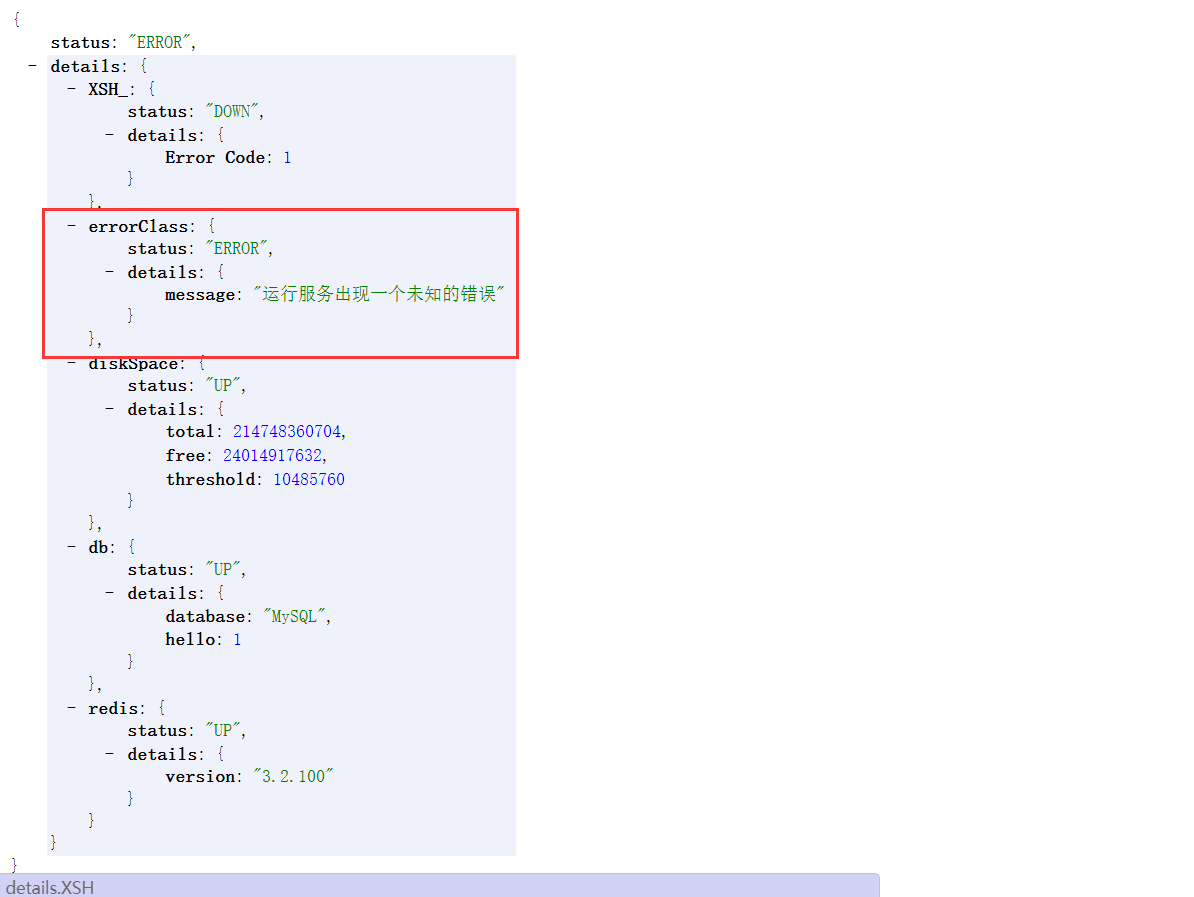
虽然此时返回的status为ERROR,但是http的响应码还是200;
在默认的4种响应状态中:DOWN和OUT_OF_SERVICE的http响应码为503,UP和UNKNOWN的http响应码为200;
新定义的响应状态如不特殊指定,则http响应码也为200。
可使用以下配置自定义响应状态的http响应码:
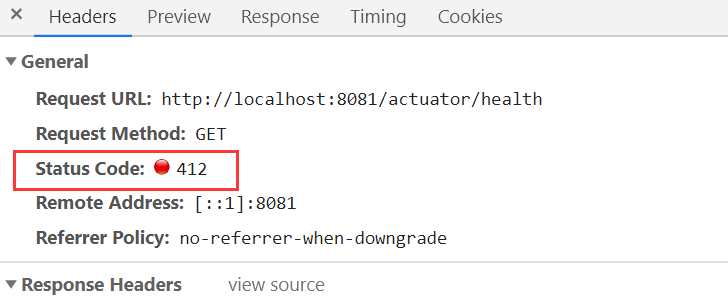
management.health.status.http-mapping.ERROR=412
重启服务再次访问,状态码已变为412
1.9 项目构建信息
如果classpath下存在META-INF/build-info.properties文件, Spring Boot将自动构建BuildProperties Bean,然后访问info端点会显示build-info.properties文件中的信息。build-info.properties文件可以通过插件自动生成。
在pom.xml文件中添加插件:
<build>
    <plugins>
        <plugin>
            <groupId>org.springframework.boot</groupId>
            <artifactId>spring-boot-maven-plugin</artifactId>
            <executions>
                <execution>
                    <goals>
                    	<goal>build-info</goal>
                    </goals>
                </execution>
            </executions>
        </plugin>
    </plugins>
</build>
运行maven插件内的build-info,生成构建信息;
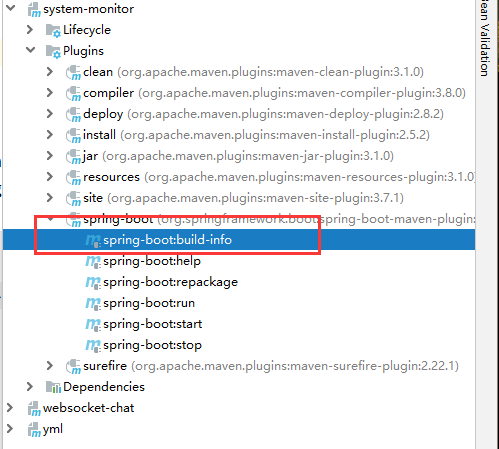
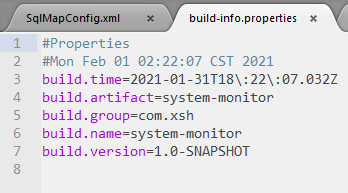
构建信息生成在当前项目目录下的target/classes/META-INF/build-info.properties文件内
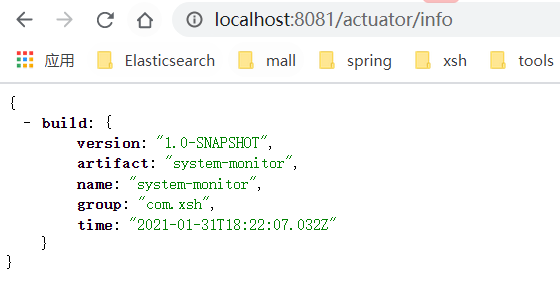
此时重启服务访问info端点,显示构建信息:
二. 监控信息可视化
虽然端点可以直接访问,但返回的信息是JSON数据,查看起来不方便。springBoot中提供了监控信息管理端,用来实现监控信息的可视化,可以可以快速查看系统的运行状况,而不用去一个一个的访问端点查看信息。
创建一个新的web服务,并在pom.xml文件内引入以下依赖:
<dependency>
    <groupId>org.springframework.boot</groupId>
    <artifactId>spring-boot-starter-web</artifactId>
</dependency>
<dependency>
    <groupId>de.codecentric</groupId>
    <artifactId>spring-boot-admin-starter-server</artifactId>
    <version>2.1.0</version>
</dependency>
在项目启动类上添加@EnableAdminServer 注解,配置server.port: 8083后启动monitorAdminServer。
浏览器访问:http://localhost:8083/index.html
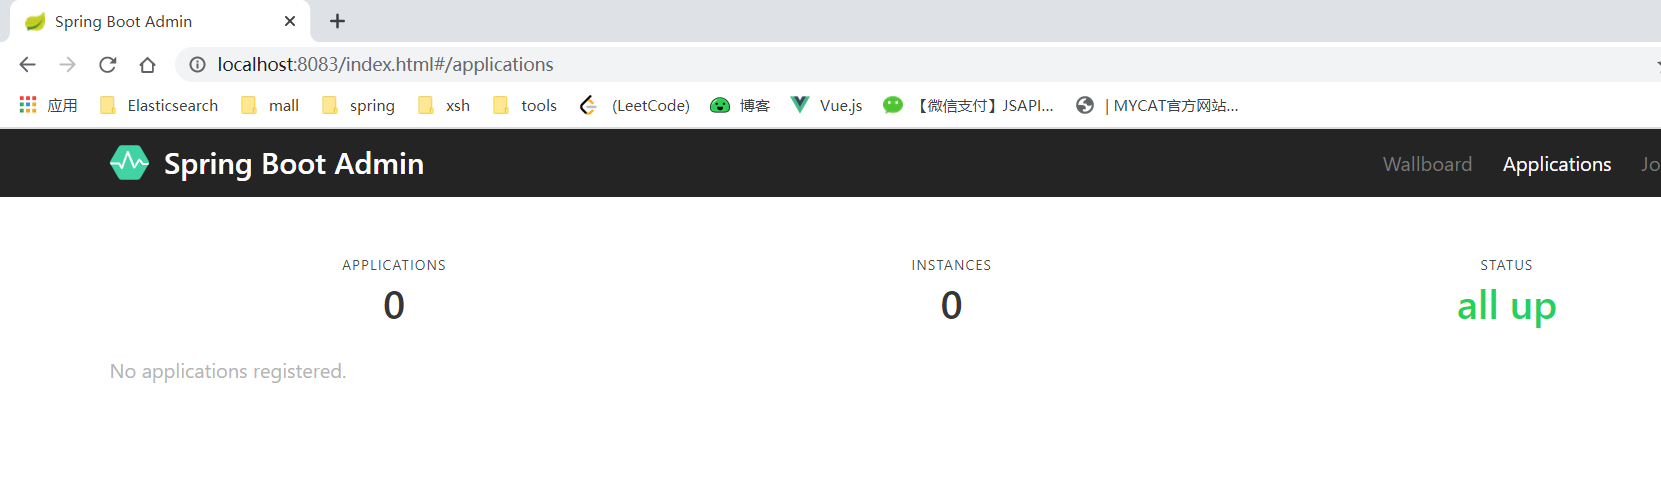
monitorAdmin端将通过图表的方式展示监控信息。
启动好可视化服务端monitorAdmin后,再配置客户端Client。
在system-monitor项目的pom.xml内引入客户端依赖:
<dependency>
    <groupId>de.codecentric</groupId>
    <artifactId>spring-boot-admin-starter-client</artifactId>
    <version>2.1.0</version>
</dependency>
然后在system-monitor项目内加入以下配置:
spring:
  boot:
    admin:
      client:
        url: http://localhost:8083
spring.boot.admin.client.url 表示配置 AdminServer服务的地址。
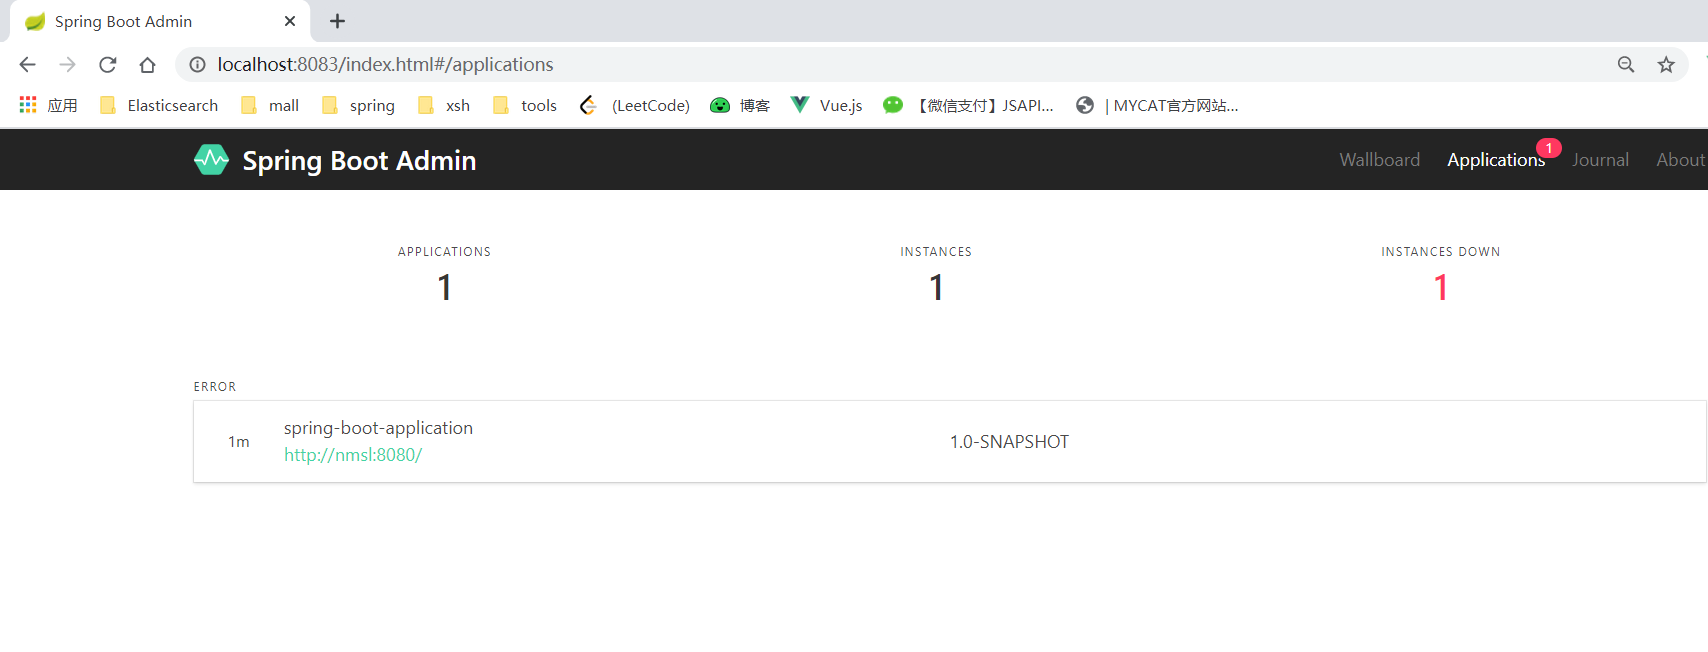
重启服务端monitorAdminServer和客户端system-monitor,再次访问http://localhost:8083/index.html
列表显示已有一个服务注册进来并监听健康情况:

因为在system-monitor服务内配置了指定权限的用户才可以访问/actuator/health,所以此时显示401;

将ActuatorSecurity文件内@Configuration注解注释上使权限验证失效,重启服务再次访问,此时状态已为绿色:
三. 邮件告警
使用AdminServer可以实现监控信息可视化,但是不可能一天24时盯着屏幕查看各应用的运行状况;如果在应用运行出问题能够自动发送邮件通知,就会方便很多。
在monitorAdminServer项目的pom.xml文件内引入邮件依赖:
<dependency>
    <groupId>org.springframework.boot</groupId>
    <artifactId>spring-boot-starter-mail</artifactId>
</dependency>
application.yml文件内加入邮件配置:
spring:
  #定义邮件发送人信息
  mail:
    host: smtp.163.com
    port: 465
    username: xsh_blog@163.com
    password: GMDVBVP********
    default-encoding: utf-8
    properties:
      mail:
        smtp:
          socketFactory:
            class: javax.net.ssl.SSLSocketFactory
        debug: true
  boot:
    admin:
      notify:
        mail:
          #发送人
          from: xsh_blog@163.com
          #收件人
          to: xsh2668028614@qq.com
          #抄送
          cc: xsh2668028614@qq.com
配置完成后,重新启动monitorAdminServer,然后启动被监控服务system-monitor;
收到邮件:

springBoot

评论